My boat, like most, has a NMEA network and a set of instruments that output data. I wondered what insights I might gain if I logged that data and analyzed it. Are there patterns? Am I sailing better or worse than I was thinking?
I decided to find out, and built a hardware device that listens to my NMEA network and logs the data. Analysis of the logged data revealed interesting insights, and I hope to use those insights to sail faster. It’s already been interesting and fun.
Figure 1 below shows part of the course I sailed during an offshore race on Lake Superior in 2019 and data I got from my boat’s network on actual performance, overlaid on top of predicted performance.
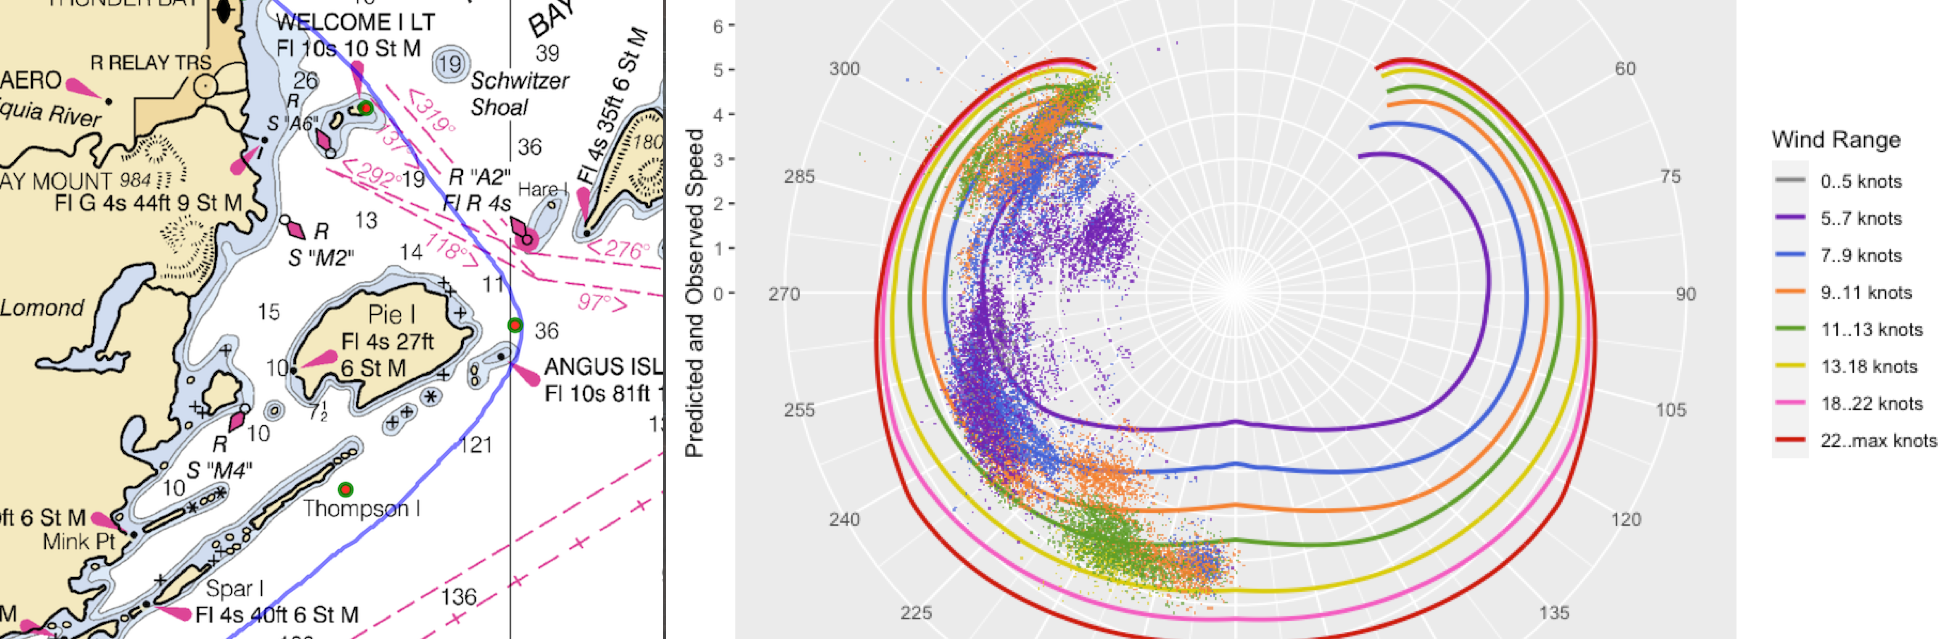
Figure 1: Course sailed with predicted vs actual performance for an offshore race
We won this race against a field of strong competition. Looking at the data, we were sailing faster than expected. In fact, during the part of this race seen on the left in Figure 1, I was thinking, “Why are we going this fast? Are these instruments even correct?”
We’d gotten into the zone. The zone is seen in the scatter plot on the right in Figure 1. It’s the clouds of purple and green in the lower left side of that plot.
Inspired by maker culture, this post introduces how I built a way to gather the data shown in this plot. The details below describe my path, and tell you how you can do this as well!
How I started gathering racing performance data
I was intrigued to see if I could build a way to open up the NMEA network on my boat to analyze the times the crew and I were in the zone. Were there reasons, unseen on the water, that could be discovered? Could the same analysis yield insights into those times when we were nowhere near the zone? As a first step, I wanted to log my data for analysis. Once I committed to the project, digging into the details allowed me to learn and have some fun.
The result is BoatThing. BoatThing is a project to unlock, analyze, and harness instrument network data to improve sailing performance. It is both a hardware device and software that can be installed easily on any boat that has a NMEA 2000 network.
Deeper analysis made possible with context
Speed over ground (SOG), velocity made good (VMG), and other metrics help me understand performance on the water at a given moment. But, momentary knowledge does not help me understand performance in the context of expected or prior benchmarks. I believe providing context will help me better understand how to improve.
For example, figure 1 shows that my actual performance (the points) varied quite a bit from predicted performance (the lines). Let me explain.
Like most racing sailors, I use Polars derived from a Velocity Prediction Program (VPP). (For example, see figure 2 below.) Polars are a rough approximation of the expected maximum boat speed given the observed wind condition. The colored solid lines are predictions for various wind speed ranges. The angle in the plot is the true wind angle relative to the boat. The radius (distance from the origin) is the expected boat speed for the wind condition referenced by the angle and the line’s color. Polars help me understand how fast I should be going and what heading I should maintain given the current wind speed and bearing.
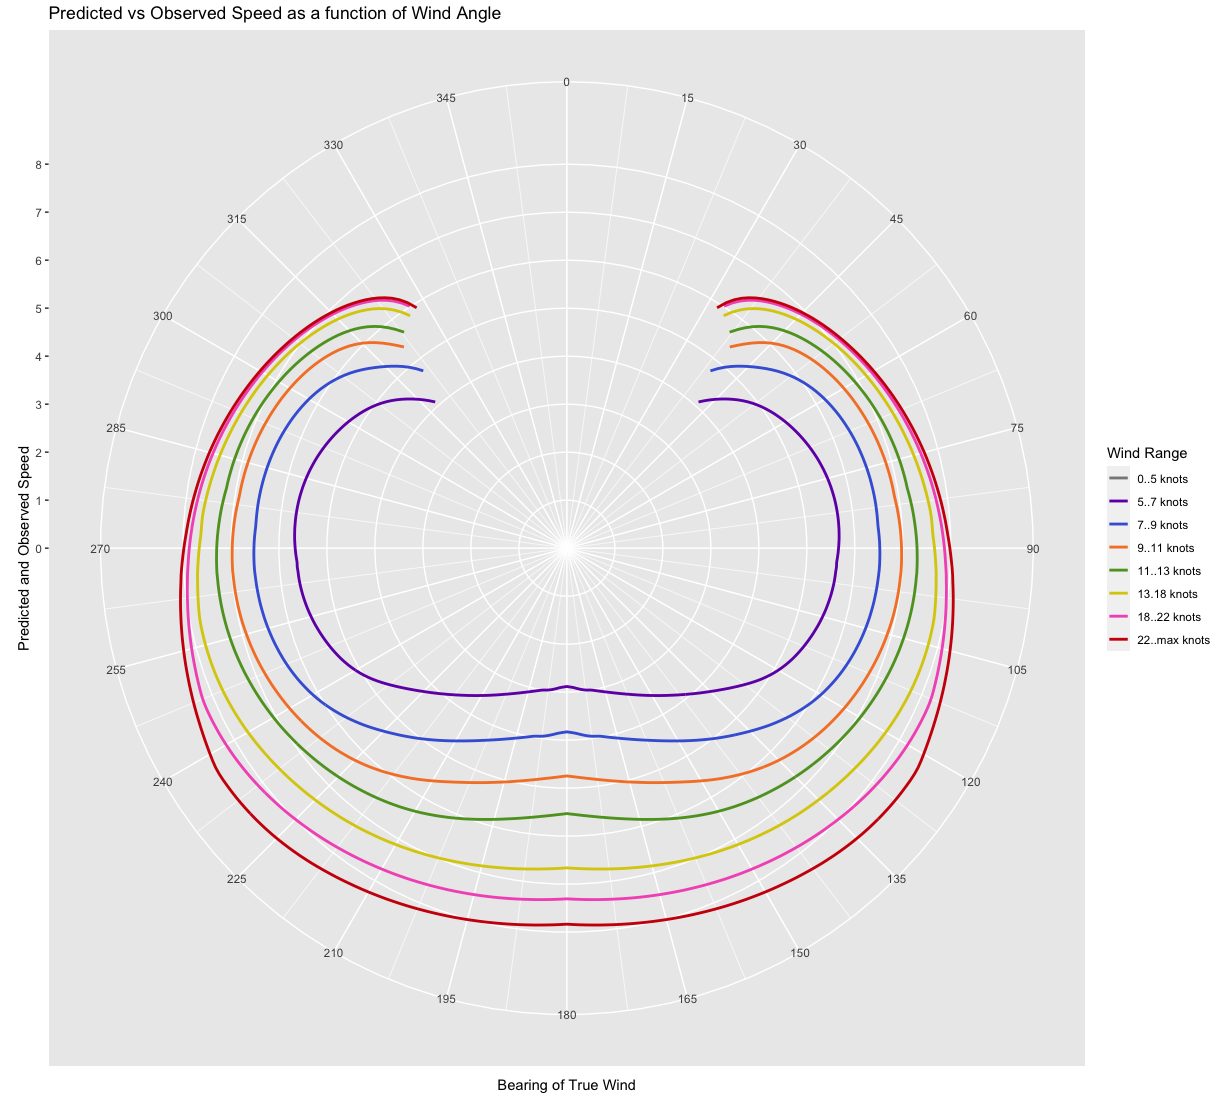
Figure 2: Polars from an Islander 36
I expect to achieve the speed predicted by the polars if my boat is in good repair, the rig is tuned, and the crew is working well together. But sea state, currents, or simple inattention and fatigue can cause us to sail either faster or slower than predicted. When I began tracking my actual boat velocity and wind speed over time, I saw an even greater range than I expected!
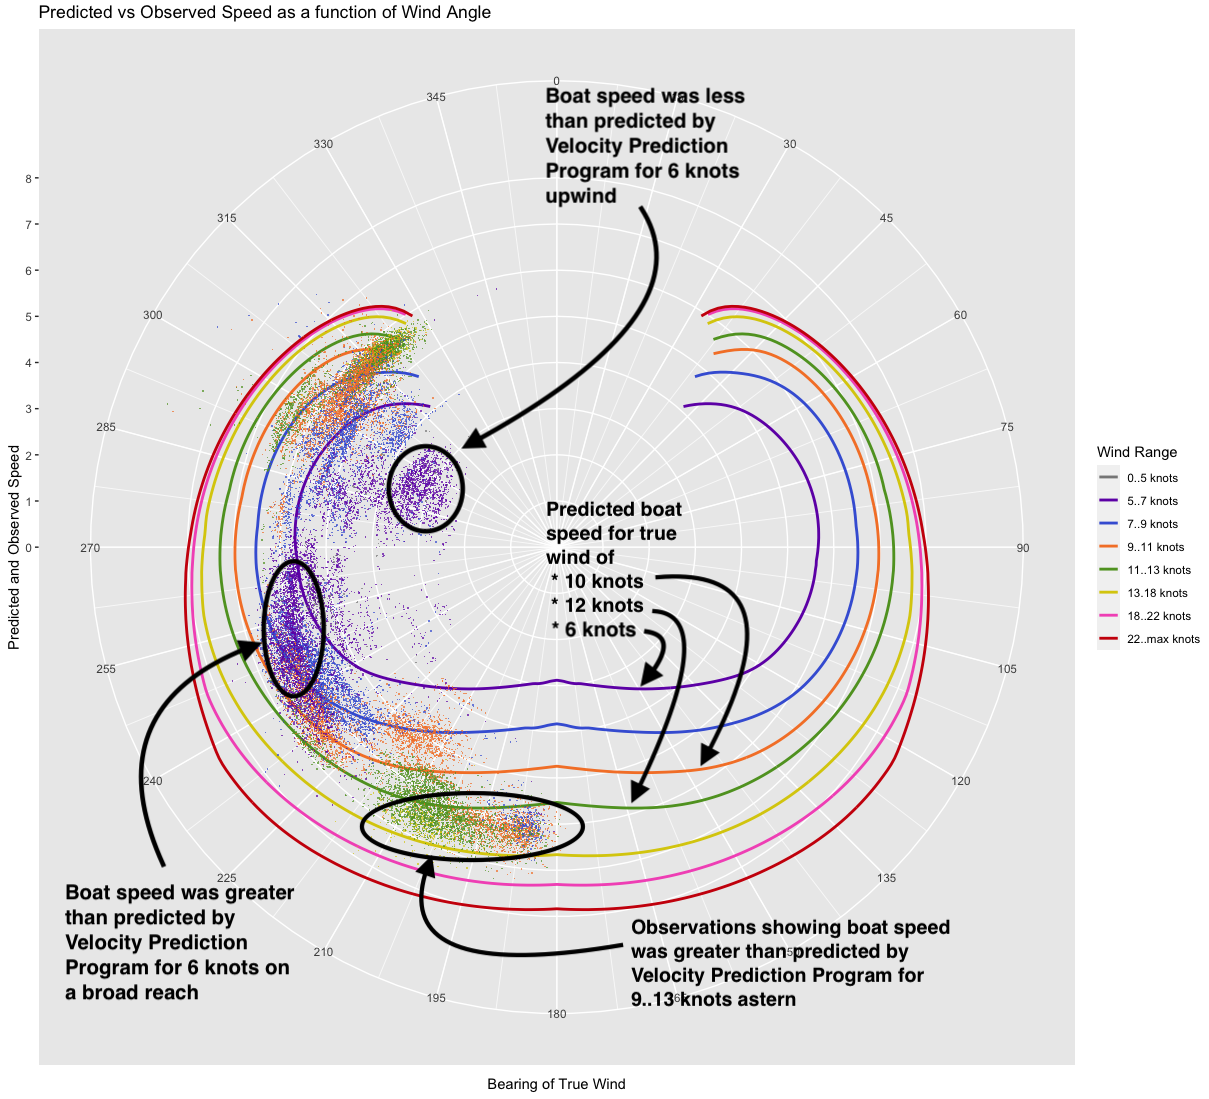
Figure 3: Downwind performance exceeds predicted while some upwind is below predicted
I overlaid my actual data from part of a race (seen in figure 1) on top of my polars. The result is shown in figure 3 above. That revealed much of my downwind performance in this section of the race was quite good, far exceeding predictions. For example, the green points (11-13 knots of wind) around 200 degrees (sailing downwind) are further away from the origin than the green line (predicted velocity for 11-13 knots of wind).
Other times, my performance was well below predictions. For example, the purple points (5-7 knots of wind) are often closer to the origin around 300 degrees (sailing upwind).
Explaining performance
But why? Was performance better because of current, sail selection, trim? Was the performance worse because of sea state, helm, tuning? Although answering these questions is difficult, I believe I can gain better insight by collecting and analyzing my data over time. These data will establish a baseline for the conditions in which I commonly sail. In fact, in a future post I’ll share a program I use to plot actual-versus-predicted performance for each leg of a race.
Moreover, I might be able to do deeper analysis. The data can be classified into non-modifiable and modifiable characteristics. Non-modifiable characteristics include wind speed, wind angle, sea state, and current. Modifiable characteristics include boat speed, trim settings, and crew weight.
Using various machine learning analytic techniques, freely available in programs such as R it should be possible to identify modifiable factors that allow us to exceed our baseline, or miss our targets, helping to raise our performance bar across the full range of conditions.
How the hardware was built, a preview with more to come
The NMEA 2000 bus used on boats is a variant of SAE J1939 which is basically CAN Bus at a higher bitrate with wider payloads. With a bit of hacking one can set up an embedded Linux SoC on something like a BeagleBone Black with a CAN tranceiver to monitor NMEA 2K traffic, and use open source software such as CANBOAT to translate the binary data stream into csv data which can be imported into analysis tools such as R.
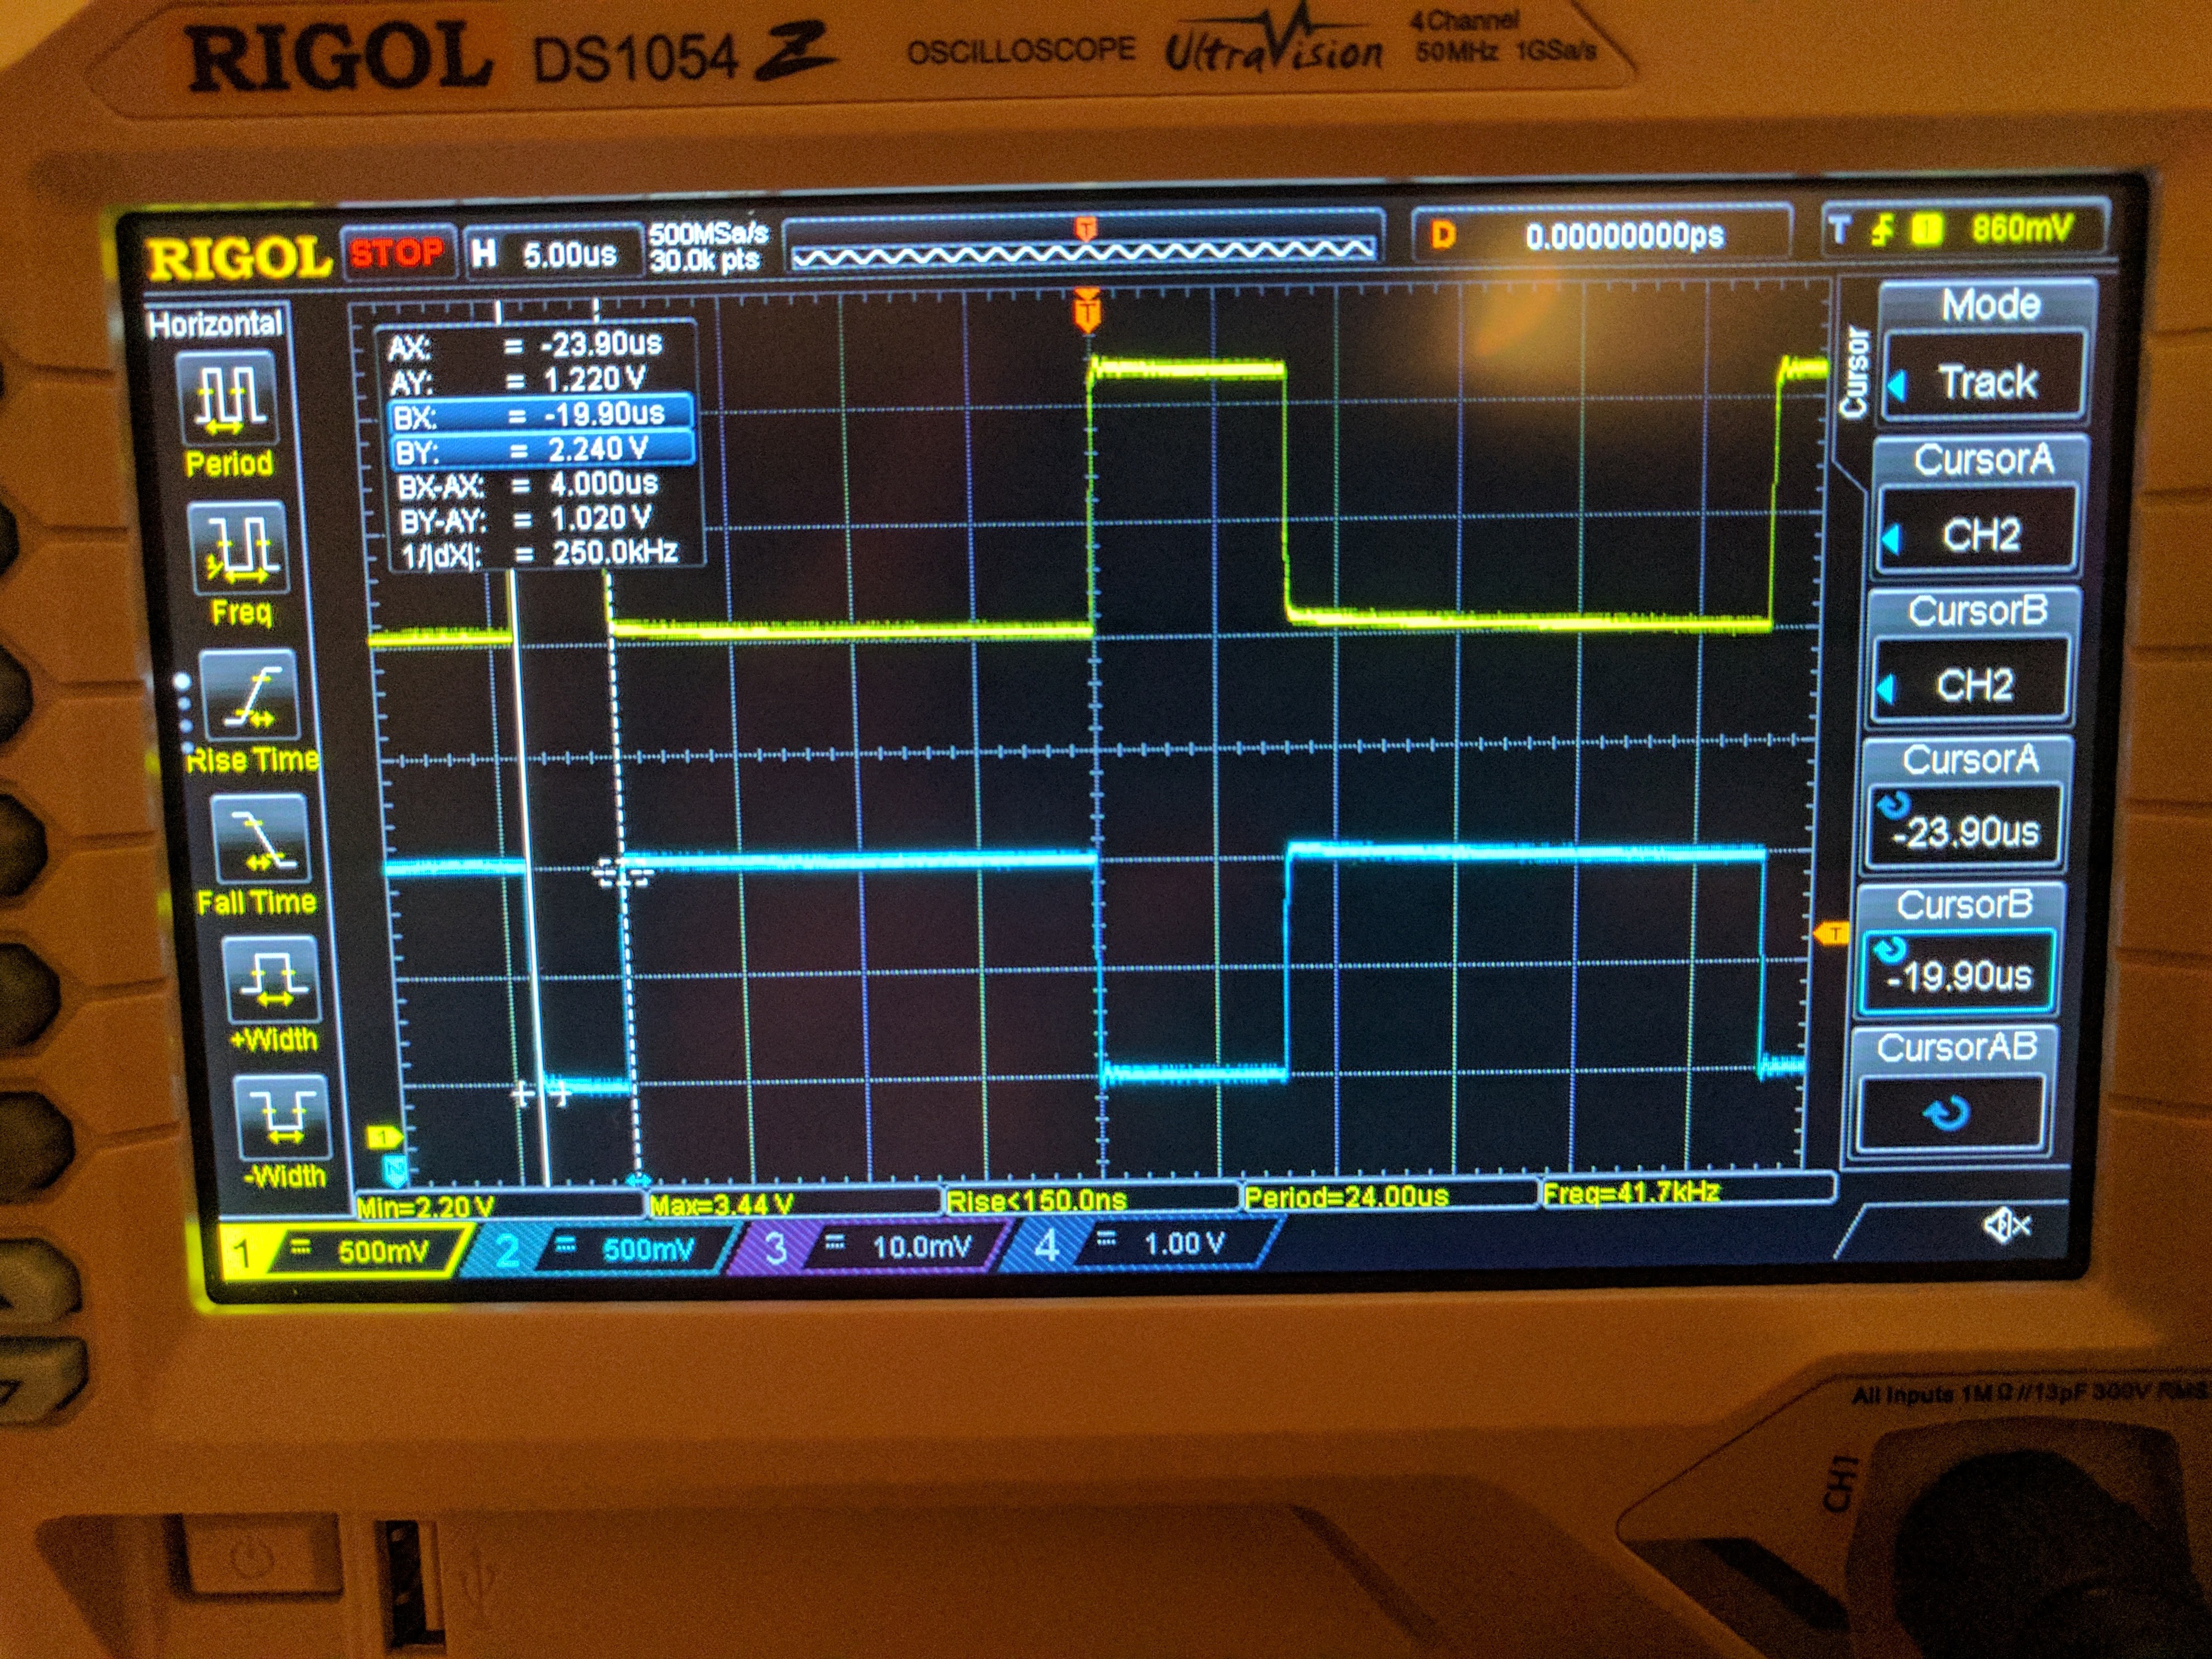
Figure 4: Oscilloscope showing NMEA 2K high/low wires
With a general purpose computing device monitoring NMEA 2K traffic in real time, there are tons of possible applications and analyses. The examples above are just the tip of the iceberg.
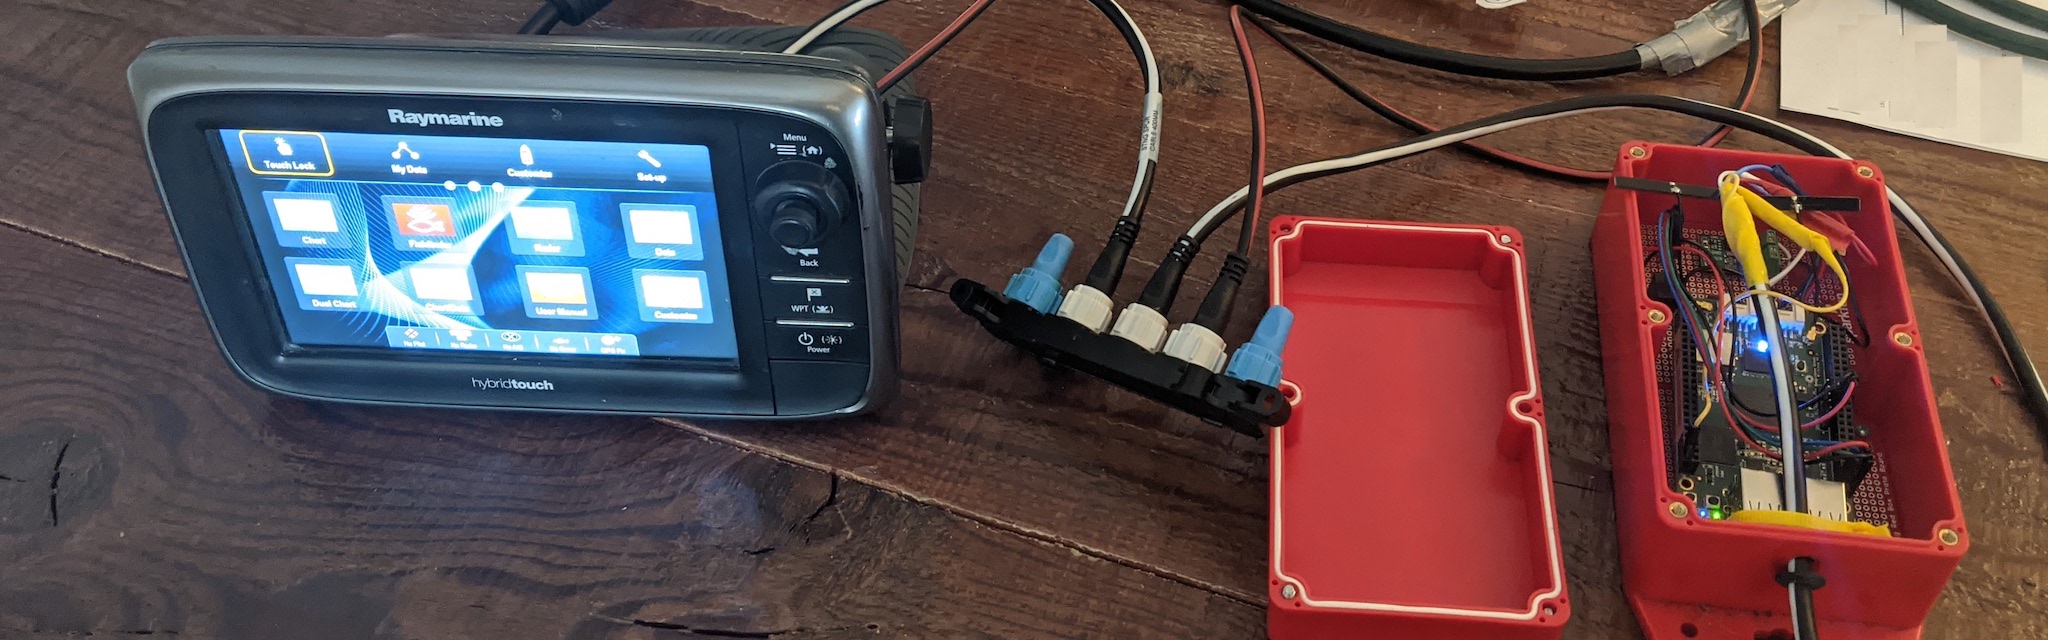
Figure 5: BoatThing running on a bench
Next Steps
My next post will describe how I created BoatThing with enough detail that you should be able to build one yourself. I’ll also assemble devices for you (at a reasonable cost) if you don’t want to build one.
In posts to follow, I’ll describe more analysis, along with snippets of R code. Then you can begin to understand how your boat is behaving on the water, and improve your racing performance!
Feel free to comment below or reach out to me at boatthing@dherring.com. Thanks!